

Showing Variances in MS Project Plan
As Project Managers, we are constantly updating our project plans to analyse the variances on a weekly basis or even more frequently. With so many unknown factors while managing a project, it becomes inevitable for the Project Manager to keep looking at the estimated timelines and factor in the risks to the schedule.
The variance analysis is a key task for the Project Managers so they can better manage the project efficiently and also help leadership understand the status of the project and its path to recovery.
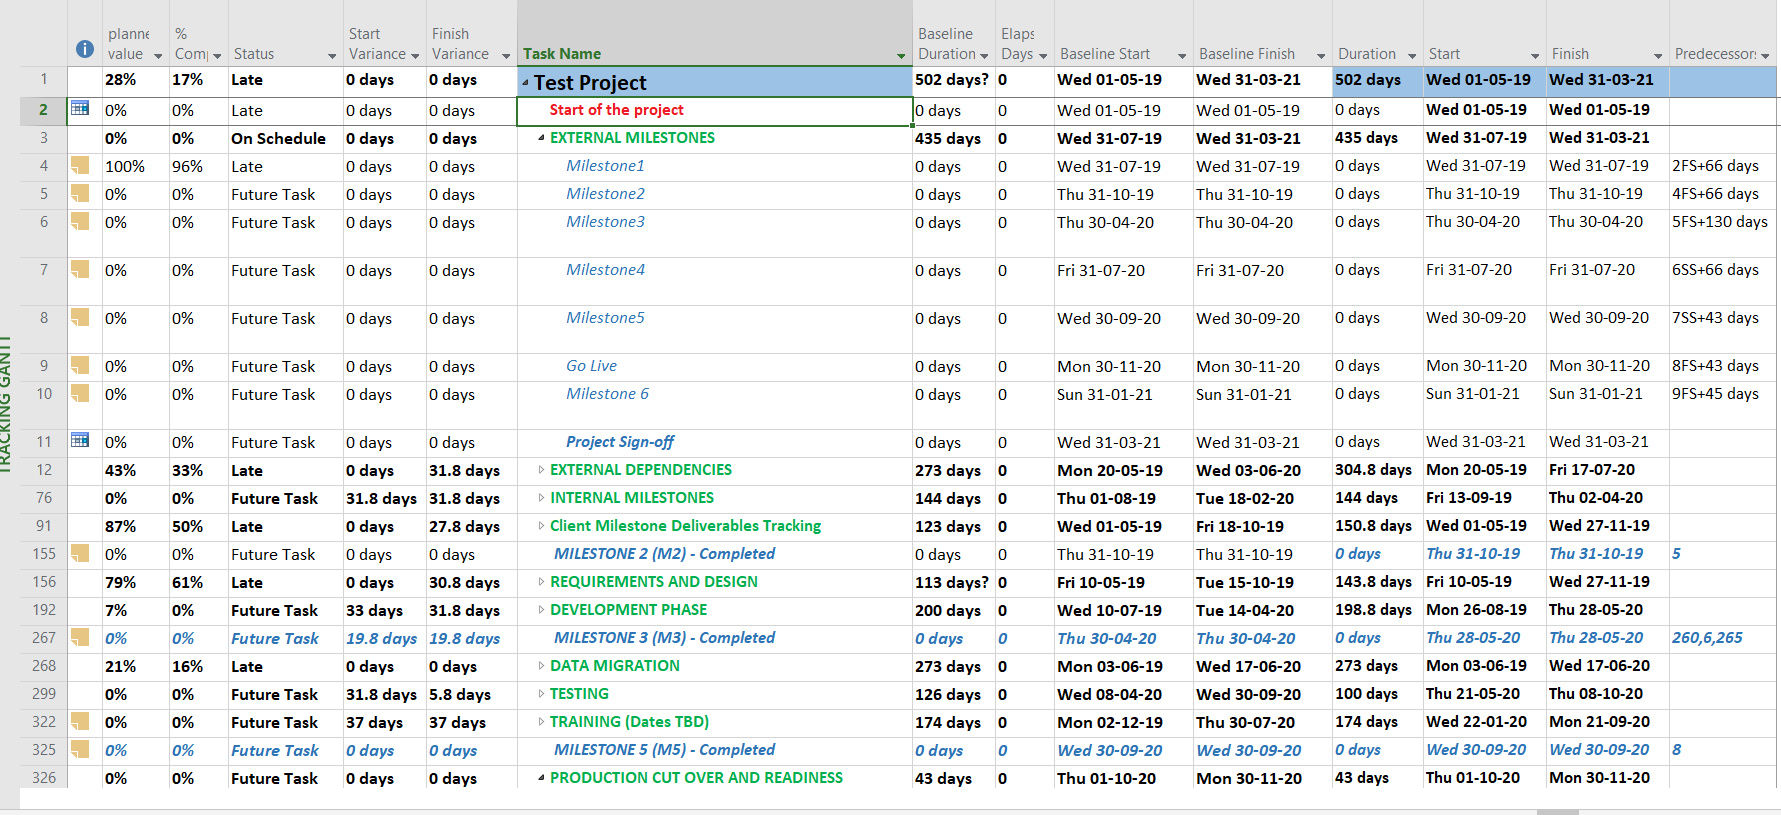
Here is a high-level typical project plan view from MS Project Schedule, that follows the standard SDLC.
Set the Project Status Date
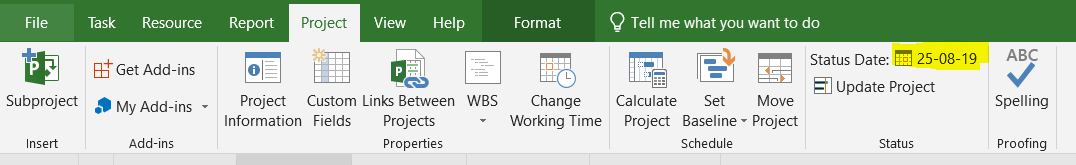
Before we understand how to create the columns to get the schedule variance of the project, we need to set the status date for the project. The Status Date is the date by when you want the project status on. In order to do this, simply select Project->Status Date.
New Columns to be added to the project
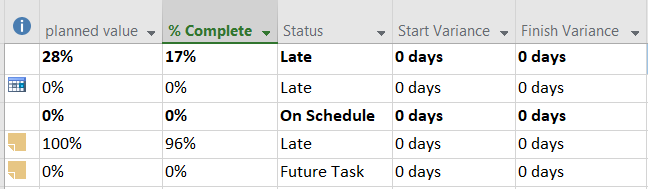
If you notice, you have the Planned value, %Complete, Status, Start Variance, Finish Variance columns added to the project plan.
The issue with MS Project is that it does not have an inbuilt Planned Value field. If you set it up as a text field, it does not roll up to the summary levels. And if you create custom fields, it is tedious to build formulae as they typically needed to be customized for also the milestone tasks.
For the fields %Complete, Status, Start Variance, Finish Variance, simply select the columns from the MS Project.
Adding the Planned Value Column
For the Planned Value column, create a new column but select the %Complete, update the planned values for each task by that status date. See the steps outlined below to do this.
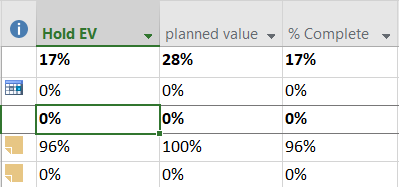
- Create a Hold EV Text Column.
- Create a Planned Value Text Column.
- Update %Complete column for that week or for that status date.
- Each week or each time you are calculating the variance, copy %Complete column into the HOLD EV Column.
- Update %Complete with %Planned (so it can roll up to the summary level)
- Once the update of %Planned is complete, copy the entire column and paste it into Planned Value column.
- Now, as a last step, Copy the Hold EV Column back into Percent Complete.
In the example above, you see the overall variance to be 11% (28%-17%). You can thus understand the status of the project whether it is Green, Yellow or Red depending on the defined Project Governance.
And the MS Project gives you whether a particular task is late, on schedule or a future task and also the variance columns show how late you are from a start date or a finish date.
#Projectstatus #VarianceAnalysis #MSProject #ProjectManagement